Bottom-up Analysis of 321 Submarkets. 2026 Market of $619.9 Billion
Bottom-up Research of 77 Submarkets. 2026 Market of 775.8 Billion.
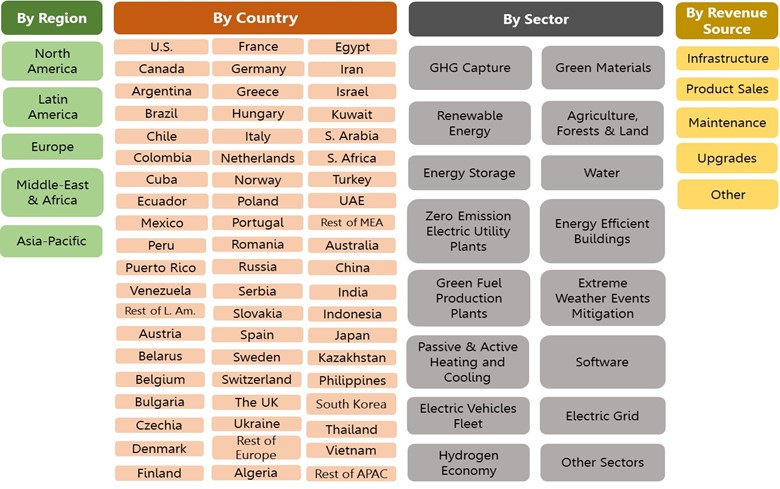
A collection of 15 Vertical, 22 Technology & 43 National Markets Reports. 377 Submarkets
2026 Market of 4,749 Billion. A Compendium of 460 Market Reports
Bottom-up Research of 311 Submarkets. 2020-2030 CAGR 13.2%
2022-2032 CAGR > 21%, Cumulative Market $117 Billion. Granulated by 323 Submarkets.
Bottom-up Research of 310 Submarkets. Cumulative 2022-30 Market $120 Billion.
Bottom-up Research of 313 Submarkets. 2026 Market $454 Billion
HSRC is an American-Israeli market intelligence & technology research firm specializing in Transformational Technologies and Public Safety Industry. HSRC provides premium market off-the-shelf and custom reports on present and emerging technologies and industry expertise, enabling global clients to gain time-critical insight into business opportunities. HSRC’s clients include the E.U., U.S. Congress & Federal Agencies, and government agencies in Japan, Korea, Taiwan, Israel, Canada, UK, Germany, Australia, Sweden, Finland, Singapore. With over 1260 private sector clients (75% repeat customers), including major Fortune 2000 companies
2026 Market of 4,749 Billion. A Compendium of 460 Market Reports
The 395-page Global Warming Mitigation & Adaptation Market & Technologies – 2022-2030 – With Corona & COP26 Impacts report contains a thorough analysis of 16 sectors, 60 technology, 5 regional, 5 revenue source and 60 national markets, detailing 460 markets. According to the report, the cumulative 2022-30 market size will reach $48 Trillion
HSRC offers customized research services geared towards providing our clients with clear, actionable recommendations designed to empower decision-making and to help exploit emerging opportunities in the Transformational Technologies & Public Safety industries. The customized research services provide a deep analysis of specific markets and eco-systems, target geographies, strategic segments and verticals, competitor analysis and technological benchmarks.
HSRC’s clients comprise the EU, NATO, U.S. Congress, DHS, U.S. Army, U.S. Navy, DOD, DOT, and U.S. GAO among others; as well as Counter Terror & PS government agencies in Japan, Korea, Taiwan, Israel, Canada, UK, Germany, Australia, Sweden, Finland, Singapore. With over 947 private sector clients (73% repeat customers), including major defense and security vendors, and Forbes Global 2000 companies, HSRC earned the reputation as the industry’s Gold Standard for Transformational Technologies & Public Safety market reports.